
Object tracking with an event camera
In this project, the Prophesee EVK4, an event-based camera based on the IMX636ES HD sensor developed in collaboration between Sony and Prophesee, was used towards developing an object tracker in 2D and 3D. Hough space transformations were utilized to fit circles and lines to event data streams. An optimization-based algorithm was developed for determining cube poses.
In this process, a ghosting effect was observed on the trailing event edges, and a sensor simulation model was developed to investigate this phenomenon.
What are event cameras?
Event cameras are vision sensors that capture changes in light intensity at each pixel as they occur, instead of capturing frames at a fixed rate like traditional cameras. Each detected change, or “event,” includes a timestamp, pixel location, and polarity, indicating whether the intensity increased or decreased. This asynchronous operation enables them to capture high-speed activity with sub-millisecond latency and minimal motion blur.
 Waving at the EVK4. Blue and white dots represent positive and negative events respectively (increases/decreases in intensity). When attempting to stay still, less events are generated.
Tracking a disc
The first step towards 3D object tracking involved tracking a 2D object, such as a coin, using recorded events from the EVK4. The Hough Circle Transform was applied to fit circles to the perimeter of the coin. An accumulator was used to represent possible circle centers and radii. Each event, lying on the disk’s edge, cast votes for circles with various potential centers and radii that could pass through it. By aggregating these votes, the peaks in the accumulator space indicated the most likely circle parameters, and the circle with the highest number of votes was selected as the best estimate for the disk’s position.
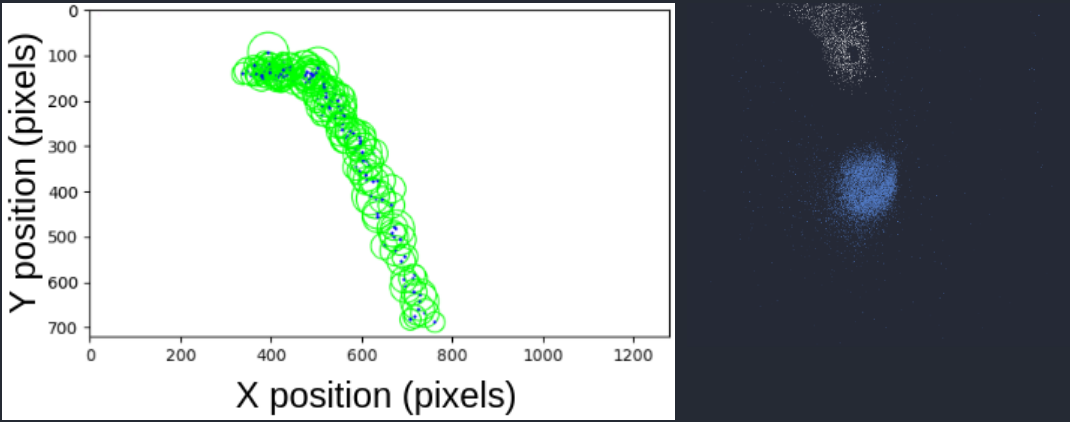 Left: Hough circle detections (green) and their centroid (blue)
Right: Events generated from coin falling in free space. Notably, the negative events (white) trail behind quite a bit. This ghosting effect prompted the development of a sensor model to gauge what was happening.
Left: Hough circle detections (green) and their centroid (blue)
Right: Events generated from coin falling in free space. Notably, the negative events (white) trail behind quite a bit. This ghosting effect prompted the development of a sensor model to gauge what was happening.
Creating a sensor model
A sensor model was developed to investigate the ghosting issues seen in the event camera footage. The datasheet for this sensor is proprietary, and SONY was unable to provide further information regarding it. However, some basic information could be gleaned from the promotional content on their event-based sensors. Namely, it was possible to obtain a high-level schematic of the analog system, displayed below, which demonstrates the process through which light rays are used to generate events.
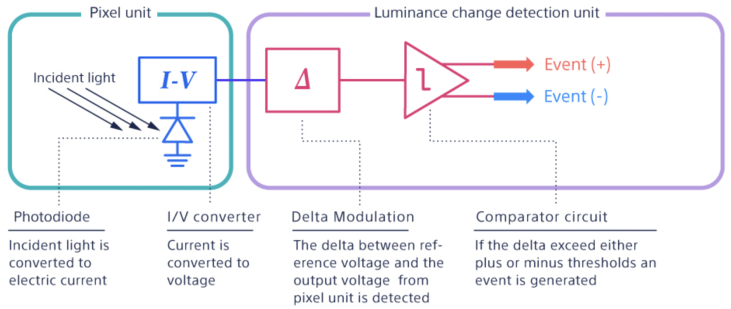 Abstract schematic of the IMX-636ES sensor at the pixel level. Taken from Prophesee
One key thing to note about the schematic above is that the analog sensor takes time to charge and discharge at the pixel level. This reality limits how quickly events can be generated relative to changes in incident brightness. Although an ideal event camera has no motion blur, this idealization breaks down in certain situations because of the sensor’s inevitable analog limitations.
We suspected that this charging and discharging had an associated time constant similar in nature to a first-order RC circuit. To replicate this effect, we passed incident light intensity data through a first-order low-pass filter, which acted to smooth out the input signal in the time domain. A first-order Butterworth filter was chosen to preserve the accuracy of the input given its relatively flat passband.
To test if the sensor’s analog limitations were responsible for the ghosting, the sensor model was made to be tested on synthetic light intensity data: a rectangle moving across the image space. The Butterworth filter was then applied to the intensity data, and the logarithm of the result was taken to get the voltage. Events were then fired probabilistically based on the difference between the reference and actual voltage. The results of the sensor model were promising:
 Event camera simulation, showing (top to bottom) light intensity, filtered intensity, intensity as voltage, reference voltage, voltage differences, and generated events (positive in white, negative in gray).
Hough line detector on an event data stream
Since our end goal was tracking a cube, we developed a line detector from events using the Hough transform once again; the idea being that each event can be used as a vote for a subset of lines parameterized by (r,θ). Within an accumulator, the index with the most votes is chosen as the best line. Nearby maxima are ignored (non-maximum suppression) to avoid duplicate detections.
For each event (x, y):
    For each angle θ:
        r = x * cos(θ) + y * sin(θ)
        acc[r][θ] += 1
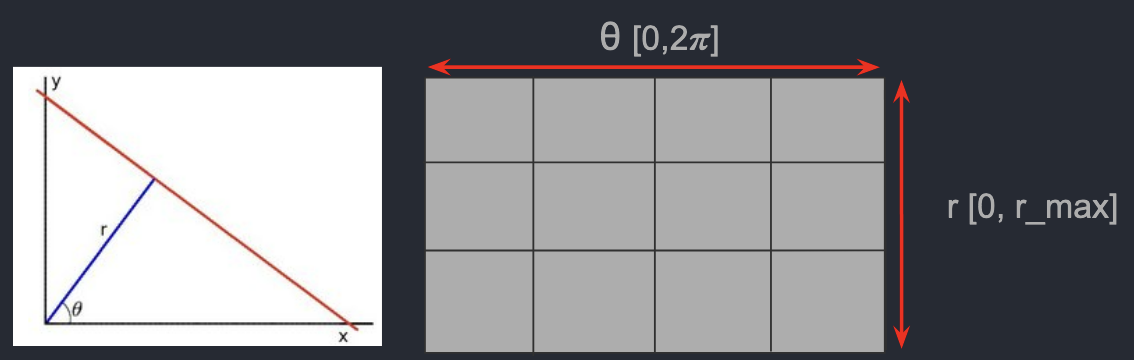 Left: Parametric representation of a line Right: Visualization of the Hough space accumulator
With this, we were able to move a Rubik’s cube (with many distinct lines) horizontally across a scene, and detect lines from its outer and inner edges. Horizontal edges are not detected since the cube is moving horizontally; there are no intensity changes to generate events in that axis.
 Hough line detector demo. Top left: Hough space with green circles indicating local maxima and neighborhood size. Bottom right: Rubiks cube being moved across the scene. The white dots are the events, and blue lines the fitted edges using the Hough detector.
Optimization-based 3D tracking
We used OpenCV’s projectPoints to connect 3D object poses with 2D image points. Our goal was to leverage the inverse problem: determine the unknown 3D pose of a Rubik’s cube by minimizing the distance between the projected points and the Hough lines.
The optimization used:
- Known object points of the Rubik’s cube.
- Camera intrinsics, calibrated via a blinking checkerboard to generate events. We used the Metavision SDK to achieve this.
- An initial guess for the 3D pose.
The objective function calculates the sum of squared distances between each projected point and the nearest detected Hough line:
def objective(x, lines, object_points):
    rvec = x[:3]
    tvec = x[3:]

    image_points = cv2.projectPoints(rvec, tvec, object_points, cameraMatrix)
    sum_dists = 0

    for point in image_points:
        min_dist = np.inf
        for line in lines:
            dist = abs(np.dot(line, np.append(point,1)))
            min_dist = min(min_dist, dist)
        sum_dists += min_dist**2
return sum_dists

result = minimize(objective, x0, args=(lines, object_points, method=Powell))
We then used SciPy to find the values of x which minimize the objective function. We opted to use the Powell method because it does not require the function to be differentiable. In doing this,
we found the rotation and translation vectors which, when used for projecting from 3D to 2D, would yield image points along our Hough lines.
Tracking Simulation
Up to this point, we had developed a method for obtaining the pose of the cube given some initial guess for it. The concern we sought to address, however, was whether or not our optimization results for arbitrary initial guesses were accurate. We thus developed a simulation with synthetic data to test if the cube was trackable while moving.
As seen in the first trial, the optimized points did not line up with the perturbed ones. We then attempted adding three additional object points in between the corners and found success: our optimizer was able to discover the pose corresponding with the correct projection despite the perturbations from the initial guess. It made the optimization a bit more specific in that it now restricted corner points to line intersections and middle points to just the lines themselves.
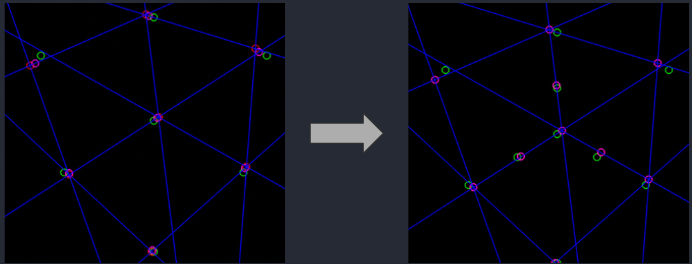
Green circles: Initial points projected using an initial guess for the pose.
Red circles: Points projected using the true 3D pose with a small amount of Gaussian noise added.
Purple circles: Points projected using the optimized cube pose.
Overall, this indicated that the pose could be calculated in a live cube-tracking application, where the previously estimated pose is fed in as a guess for the current. This hinges on the requirement that the movement between frames is not exceedingly high.
Future Work
The tracking simulation shows that our event-based Hough line detector can be integrated with our optimizer to compute the 3D pose of the cube in a frame-by-frame manner. The next steps would involve integrating these features and testing with a live event data stream.
Acknowledgements:
Thanks to Rezwhan Kamal, Professor Matthew Zucker, Professor Stephen Phillips for collaboration and guidance.